The January 2008 unwind of Jerome Kerviel's trades at Societe Generale created a tremendous amount of market chaos into a largely illiquid market because of the American holiday on which the unwind began. With the American markets expecting slow trading during Dr. Martin Luther King Day, it was quite a shock for European equity markets to have opened lower and not be able to find a bottom throughout the session on no headline news or explanation.


Ultimately however, both moves in interest rates and equity index futures were in line with the trend which would culminate in disastrous late year volatility for all markets.


Click to enlarge
The first chart is the one minute EuroStoxx 50 futures on January 21, 2008 which shows the consistency of decline during the European session.

Click to enlarge
The above five minute chart of the H08 emini S&P 500 futures really shows how sever the decline was for the US index, likely because so many were caught buying a small dip in quiet holiday trading which soon became a one way bloodbath. On Sunday night going into the holiday the S&P futures opened at the 1330 level and slid 1% into the European open before eventually trading to just above limit down a reaching a low of 1256.25 midway through the European session, a slide of over 5% on no news. Once the market reopened in the afternoon, there was some stabalization early but a fearful mood reemerged as the emini S&P trading limit down for about two hours as Europe opened.
Although the market at large was left wondering what was causing the freefall, the Federal Reserve had knowledge of the situation and took the extreme step of an intermeeting rate cut by slashing the Fed Funds rate by 0.75% on the morning of January 22nd and then cut it a further 0.50% the following week on January 30th to a rate of 3.00%.
To put a human face on the pain this move caused, a videoblogger recorded a personal meltdown during the midst of the January 20-21st trading sessions.
(embedding isn't working but here is the link: http://youtu.be/vIMwMsY0ndo so just click on that for it)
(embedding isn't working but here is the link: http://youtu.be/vIMwMsY0ndo so just click on that for it)
Ultimately however, both moves in interest rates and equity index futures were in line with the trend which would culminate in disastrous late year volatility for all markets.

Click to enlarge
Above is the daily chart of the H08 emini S&P for a bigger picture view.

Click to enlarge
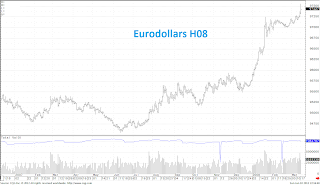
And also a daily chart of H08 eurodollar interest rate futures to illustrate the rate moves on the short end.
1 comment:
I watch that video all the time - after all, at different points of the trading year, I know that is me in varying degrees.
also, with the flash crash - i was really lucky not to have been playing the markets that day. I don't think i would have been able to get out of that session without major losses.
i still remember being in the car dealership watching in shock as the markets were plummeting.
Post a Comment