Wednesday, September 19, 2012

Great grain bull of 2008, killed by MF rogue trader


I didn't realize it at the time but in retrospect the great grain bull market of early 2008 peaked on the liquidation of the rogue trader at MF Global which stuck the firm with a $141 million dollar loss.  The best explanation of the circumstances are in the DOJ press release:

DOJ: MEMPHIS AREA MAN INDICTED FOR CAUSING MF GLOBAL TO LOSE $141 MILLION ON UNAUTHORIZED TRADES OF WHEAT FUTURES CONTRACTS AT CHICAGO BOARD OF TRADE IN 2008

Amazing to think that at the peak of the grain bull he was short 17,181 wheat contracts on that night by the time it was limit up!  Click to enlarge all charts.


Above is that night's 1 minute chart of May Chicago wheat which he was mainly short and the volume is shown below. 

On a bigger picture time frame to understand the entire grain bull, here is some longer term perspectives,

Above is daily Chicago March wheat.

Above is 30 minute Chicago March wheat top.

Above is daily KC March wheat.

Above is the top in KC March wheat 1 minute chart.

Above is the top in KC March wheat 30 minute chart.

Above is Minneapolis March wheat, really amazing move and I got to hear some legendary stories when I was up there for the floor closing at year end. 

Above is the top in Minneapolis March wheat, 1 minute chart.

Above is the top in Minneapolis March wheat, 30 minute chart.

Sunday, September 9, 2012

September 11, 2001 charts


Here's a huge dump of charts from 9/11/2001 and a bit further extended time frames, a lot of interesting things in retrospect.  The price levels for all contracts are pretty surprising a decade later now and I am more surprised by the non-moves rather than the moves, especially in how I would've expected certain geopolitical hedges would've moved.

*Click to enlarge all charts*


To lead off is the the September e-mini S&P one minute chart but because the Sept contract expired later that week, the best reference for spoos is the December charts outlayed below.

Above is December e-mini S&P chart, daily

Above is December e-mini S&P chart, 5 minutes

Above is December e-mini S&P chart, 1 minute

Above is WTI NYMEX November crude chart, daily.  Pretty amazing how low oil was trading back in those days by "spiking" to 31/barrel before settling a month later in the low 20s

Above is WTI NYMEX chart, five minutes

Above is COMEX December Gold, daily.  Again it's surprising that the spike was 'only' to 300/oz up from the low 270s that morning.

Above is COMEX December Gold, 5 minutes

Above is the Swiss Franc December contract, daily.

Above is Swiss Franc December, 1 minute

Above is Euro currency FX December, daily

Above is Euro currency FX December, 5 minute

Above is 30yr US Treasury December, daily

Above is 30yr US Treasury December, 1 minute

Above is 2yr US Treasury Note December, daily.  Notice how little open interest there was in this contract back then!

Above is 2yr Treasury Note December, 5 minute.

Above is Eurodollar interest rate September, daily

Above is Eurodollar interest rate September, 1 minute

Above is Eurodollar interest rate December, daily

Above is Eurodollar interest rate December, 1 minute

Wednesday, June 13, 2012

Eurodollar open interest vs. S&P 500


Click to enlarge

I dusted this chart off last night and sent it to a bud so figure I'll put it up here as well although I'll note that it was grabbed late last year so isn't perfectly up to date.  
 
The financial industry boom/bust of the 2000s was quite amazing and will be tough to match again in my lifetime.  Above is a chart which really illustrates the rise then fall of the era's expansion with the top half being the weekly S&P 500 price and the bottom chart showing open interest on eurodollar short term interest rate futures (LIBOR).  Before putting the two figures side by side, I was aware of a correlation between the equity market and the financing market but was surprised it was this precise.  

Sunday, June 10, 2012

SocGen rogue trader blowout

The January 2008 unwind of Jerome Kerviel's trades at Societe Generale created a tremendous amount of market chaos into a largely illiquid market because of the American holiday on which the unwind began.  With the American markets expecting slow trading during Dr. Martin Luther King Day, it was quite a shock for European equity markets to have opened lower and not be able to find a bottom throughout the session on no headline news or explanation. 

Click to enlarge

The first chart is the one minute EuroStoxx 50 futures on January 21, 2008 which shows the consistency of decline during the European session.  

Click to enlarge

The above five minute chart of the H08 emini S&P 500 futures really shows how sever the decline was for the US index, likely because so many were caught buying a small dip in quiet holiday trading which soon became a one way bloodbath.  On Sunday night going into the holiday the S&P futures opened at the 1330 level and slid 1% into the European open before eventually trading to just above limit down a reaching a low of 1256.25 midway through the European session, a slide of over 5% on no news.  Once the market reopened in the afternoon, there was some stabalization early but a fearful mood reemerged as the emini S&P trading limit down for about two hours as Europe opened.  

Although the market at large was left wondering what was causing the freefall, the Federal Reserve had knowledge of the situation and took the extreme step of an intermeeting rate cut by slashing the Fed Funds rate by 0.75% on the morning of January 22nd and then cut it a further 0.50% the following week on January 30th to a rate of 3.00%

To put a human face on the pain this move caused, a videoblogger recorded a personal meltdown during the midst of the January 20-21st trading sessions.
(embedding isn't working but here is the link: http://youtu.be/vIMwMsY0ndo so just click on that for it) 

Ultimately however, both moves in interest rates and equity index futures were in line with the trend which would culminate in disastrous late year volatility for all markets.

Click to enlarge

Above is the daily chart of the H08 emini S&P for a bigger picture view.

Click to enlarge

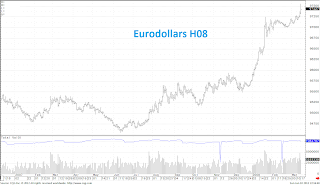
And also a daily chart of H08 eurodollar interest rate futures to illustrate the rate moves on the short end.


Thursday, June 7, 2012

Flash Crash


The "Flash Crash" really was scary for anyone who traded through it and in a way reminded all market participants of the fury which can occasionally be unleashed so swiftly and severely. 


Click to enlarge

The above is a 1 minute chart of the emini S&P 500 during the day of the flash crash.  As can be seen, a lot of volume chased the market down resulting in a crescendo where the low point also experienced the highest volume before turning around and retracing most of the move rather quickly.  

Click to enlarge

The emini Nasdaq also shows an identical move of a high volume peak as the market found bottom before screaming up.  

Click to enlarge

Front month eurodollars had a similar move which tracked equities as often is the case during market panics and the contract had a 15bps fall in a matter of minutes.  Something was definitely weird about the day and I can remember getting as hedged as possible right before the spike down which really saved me that day.  From what I recall, the order book was ultra thin and selling an offer was impossible before the freefall and that's as sure as sign on what direction the market is going. 

Click to enlarge

On the flipside, the eurodollar contract a year further had a flight to safety spike which virtually mirrored the front month's move. 


Click to enlarge

Which resulted in the M10/M11 eurodollar spread to move from 75 before the move to as low as 42.5 with the vast majority of that happening in a few minutes.  Another chart which hurts to look at just thinking about how painful it'd be to sit unhedged on. 


Click to enlarge

Or course there is no greater flight to safety than long term US treasuries and above is the 30yr.

Click to enlarge

Crude surprisingly wasn't as correlated to panic as other markets but nonetheless had a severe move in it's own right.

Click to enlarge

And for the hell of it here's the euro currency chart which like crude panicked lower but not like equities.

Click to enlarge

Same goes for gold, a move but easily stayed within the earlier day's range.

Thursday, May 31, 2012

Stand by

Just an FYI that I didn't launch the blog then abandon it.  There was some additional market data I was trying to obtain and just kinda focused on that (and travel, trading, etc...).  But I'll roll out some additional stuff in the next few days.....


Monday, May 21, 2012

Millennium Fly

One of the most legendary moves at the CME easily involves the "millennium fly" which was a butterfly spread based upon the September 1999, December 1999 and March 2000 eurodollar contracts.  The fly was a concentrated play upon interbank funding at the turn of Y2K and became far more volatile than any such spread before or since.  


Click to enlarge

Like most eurodollars butterflies, the millennium fly had a typically tight range but suddenly exploded upward in November 1998 from about 20 to over 80 in about a months time with the majority of the move coming in a couple weeks.  Even though it was before my time in Chicago, it still hurts to look at the chart knowing the pain such a move could and did inflict.

I don't know if the catalyst was a desk trade recommendation at the time of the breakout but the web magazine Derivatives Strategy noted in the following article: A Trade for Millennium Jitters

"The underlying justification for the trades is that investors may express their aversion to Y2K computer snafus by moving money out of deposits in software-laden banks and into fixed-income securities, such as Treasuries or bearer paper. This could put a squeeze on bank liquidity and drive up money-market rates in December 1999, relative to levels in either September 1999 or March 2000. To take advantage of this spike for the eurodollar, Sturm is recommending selling two December ‘99 eurodollar futures and buying one each of the September ‘99 and March ‘00 contracts.

“If you analyze the performance of a year-end ‘butterfly’ over the last 10 years, you can see that, with six quarters to expiry, you have a 90 percent confidence that it will be priced between one tick and 15 ticks,” says Sturm. “By that stage this year, however, the millennium eurodollar butterfly was trading at 18 ticks, which you can approximate as the price tag that the market is putting on the potential financial disruption of Y2K.”


Click to enlarge

As the article also noted, there was a similar scenario in the Japanese interest rate market and the trade to focus on Y2K funding in the euroyen was known as the "dragon fly."  This trade was structured differently because of the March 31 fiscal year end in Japan and the dragon fly was positioned like an unratioed condor EYU99-EYZ99-EYH00+EYM00.

Really amazing stuff and another case that the only thing that matters is liquidity.  Just as amazing is that the desk recommended the trade at the beginning of the move.

Thursday, May 17, 2012

VA Linux

With a lot of Web 2.0 companies going public lately and some talk of a speculative bubble, I thought it'd be good to illustrate the apex of insanity during the first dotcom bubble w/charts of VA Linux.  In December of 1999 the open source software company became regarded as the most 'successful' IPO of all time with a pricing at $30/share and an opening print of 299, traded as high as 320 but then closed at 239.25 on the day.

 A couple articles from the web 1.0 media recap what happened first in real time and then a decade later:

 Dissecting the VA Linux IPO from salon.com

10 years gone: The VA Linux Systems IPO from cnet

Click on chart to enlarge

Pretty wild that at the end of the day LNUX had a market cap of something like $7 billion and that year only did around $20 million in revs reporting a loss, of course, of around $15 million.  Of course it wouldn't last and within a year the stock was under $10.   By the time the lockup expired six months after the IPO it was just a little bit above the IPO price of 30 by trading at 38.50 which is really tough luck for the insiders. 


End of Lockup Period for VA Linux Doesn't Feel Too Liberating  sfgate.com

Click on chart to enlarge

That era was a wild time and while I was too young at 19 to get a piece of it but as a consolation I was able to witness some of the insanity being on an order desk at the CME directly below the NASDAQ pit.  In the future I'll roll out some more dotcom stocks but am trying to stick to futures.

Believe it or not, VA Linux still exists in some form as it was bought by Geeknet now under the symbol GKNT.

Euroswiss

Alright I'm gonna kick off the new blog with a more recent extreme move that totally changed my perception of how short term interest rate futures can trade.  Simply put the value of a contract is 100 - value to equal the interest rate, for instance Sept 2012 eurodollars are currently 99.40 which indicates an interest rate of 0.60%.

In late 2011, the euroswiss contract (3month libor rate on swiss franc borrowing) traded as high as 100.71 on August 18th indicating a negative rate of 71 basis points!  It's quite apparent from the chart below of the Dec 11 Euroswiss contract that once it pushed through the zero barrier, the liquidity thinned out and a parabolic move ensued.  (Click on charts to enlarge)


Somewhat confusing for me is that euroswiss peaked on August 18th but the actually currency itself peaked on August 9th. 

On September 6, 2011 the swiss franc was effectively pegged against the euro w/a floor of 1.20 and on that day the CME's SFZ11 had a range from 128.54 to 116.37, closing on it's low.


As always, I'm looking to be enlightened in the comment box if anyone can add anything further beyond the obvious.  There isn't much written on negative interest rates but I simply presented these charts to show the chaos of a liquidity squeeze.  FYI, euroswiss is still indicating a slightly negative interest rate at the moment.

As General George Patton noted, “Fixed fortifications are a monument to the stupidity of man" and the same goes for fixed market ideas.